Question 82 of 308
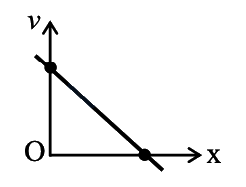
The velocity - Distance graph is shown in figure. Which graph represents acceleration versus distance variation of this system?
Show answer and solution
Answer: (A) 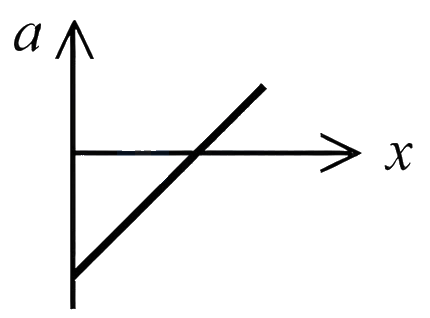
The v-x graph shows velocity decreasing linearly with distance. Using kinematic equation , we can establish the relationship between acceleration and position.
From the linear v-x relationship, differentiating using yields acceleration that is linearly proportional to distance from the origin.
The a-x graph shows a straight line passing through the origin with positive slope, indicating that acceleration increases linearly with distance while remaining positive throughout the motion.