Question 25 of 168
For a particular ideal gas which of the following graphs represents the variation of mean squared velocity of the gas molecules with temperature?
Show answer and solution
Answer: (B) 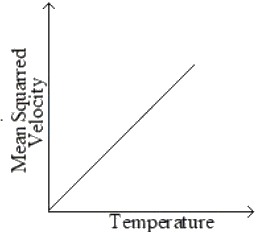
$\begin{aligned}
& \mathrm{V}_{\mathrm{ms}}=\sqrt{\frac{3 \mathrm{RT}}{\mathrm{M}}} \\
& \mathrm{~V}_{\mathrm{rms}}^2=3 \mathrm{RT} / \mathrm{M}
\end{aligned}$
Hence we can conclude that is directly proportional to temperature
Graph will be straight line
& \mathrm{V}_{\mathrm{ms}}=\sqrt{\frac{3 \mathrm{RT}}{\mathrm{M}}} \\
& \mathrm{~V}_{\mathrm{rms}}^2=3 \mathrm{RT} / \mathrm{M}
\end{aligned}$
Hence we can conclude that is directly proportional to temperature
Graph will be straight line
