Question 58 of 168
The plot that depicts the behavior of the mean free time (time between two successive collisions) for the molecules of an ideal gas, as a function of temperature qualitatively, is: (Graphs are schematic and not drawn to scale)
Show answer and solution
Answer: (C) 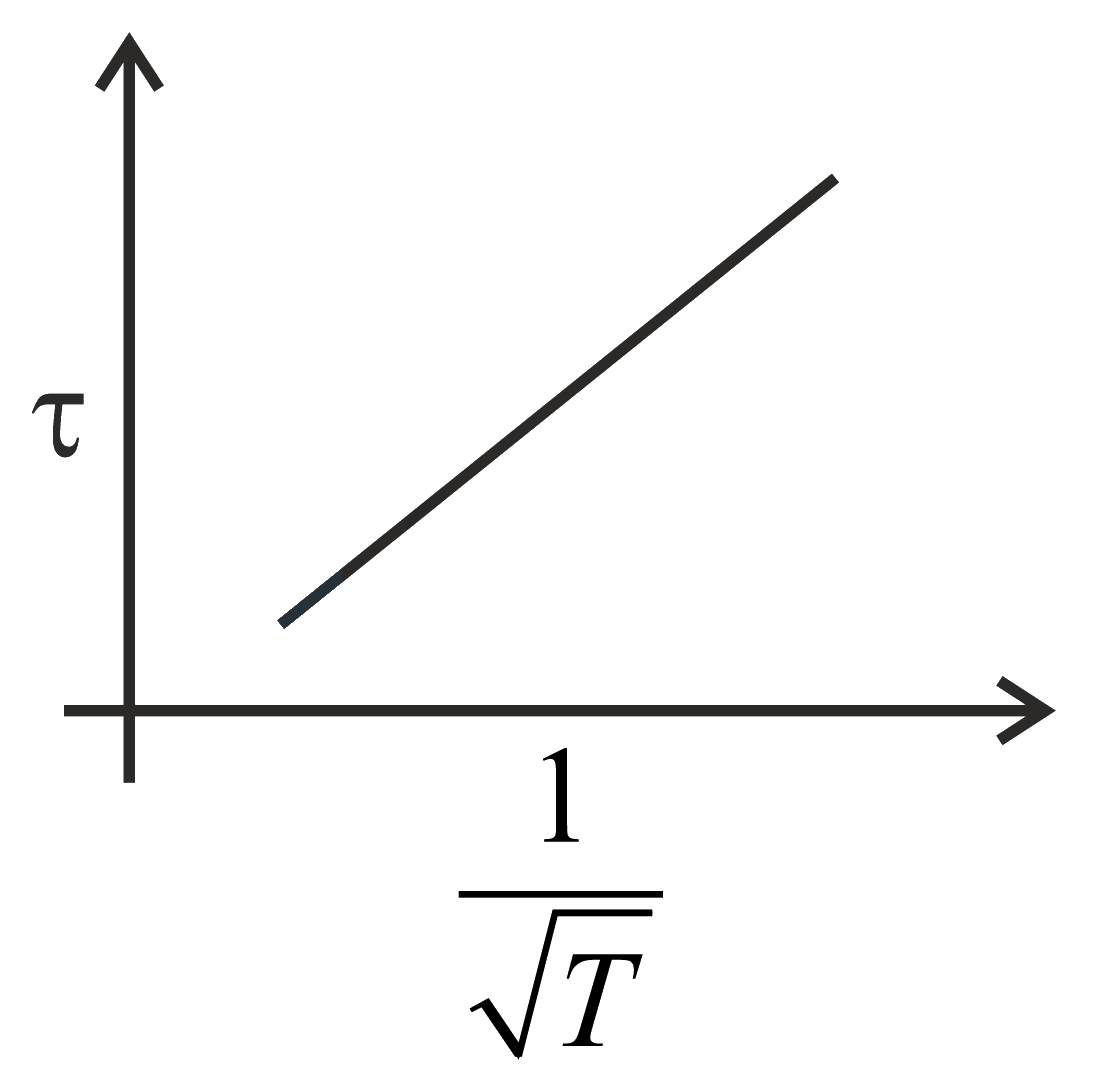
The average time taken by a moving particle between successive collisions or impacts is referred to as the mean free time .
The average distance a moving particle travels between successive collisions or impacts is referred to as the mean free path .
and
So, the mean free time
Therefore,
The average distance a moving particle travels between successive collisions or impacts is referred to as the mean free path .
and
So, the mean free time
Therefore,
