Question 19 of 210
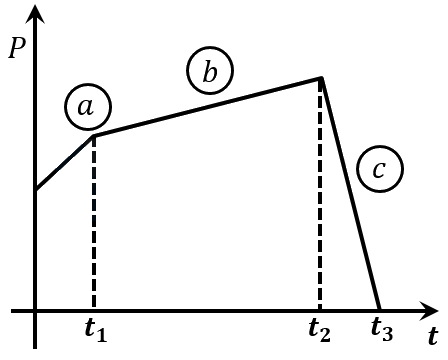
The figure represents the momentum time curve for a particle moving along an axis under the influence of the force. Identify the regions on the graph where the magnitude of the force is maximum and minimum respectively ?
If
Show answer and solution
Answer: (C) c and b
From Newton's second,
From the given graph, we can see that slope of region is maximum and slope of region is minimum.
Thus, .