Question 64 of 130
A thin rod of length ' ' is lying along the -axis with its ends at and . Its linear density (mass/length) varies with ask , where can be zero or any positive number. If the position of the centre of mass of the rod is plotted against ' ', which of the following graphs best approximates the dependence of on ?
Show answer and solution
Answer: (A) 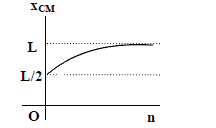
%20varies%20with%20x%20ask%20((x)%2F(L)%20)%5En%2C%20where%20n%20can%20be%20zero%20or%20any%20positive%20number.%20If%20the%20position%20xCM%20of%20the%20centre%20of%20mass%20of%20the%20rod%20is%20plotted%20against%20'%20n%20'%2C%20which%20of%20the%20following%20graphs%20best%20approximates%20the%20dependence%20of%20xCM%20on%20n%20%3F%0A(A)%20%3Cimg%20src%3D%22%2Fpractice%2Fpyq%2Fcenter-of-mass-momentum-and-collision64o0599.png%22%3E%0A(B)%20%3Cimg%20src%3D%22%2Fpractice%2Fpyq%2Fcenter-of-mass-momentum-and-collision64o1600.png%22%3E%0A(C)%20%3Cimg%20src%3D%22%2Fpractice%2Fpyq%2Fcenter-of-mass-momentum-and-collision64o2601.png%22%3E%0A(D)%20%3Cimg%20src%3D%22%2Fpractice%2Fpyq%2Fcenter-of-mass-momentum-and-collision64o3602.png%22%3E)