Center of Mass, Momentum & Collision

JEE Main level, single correct, medium

75 of 130

Question 75 of 130

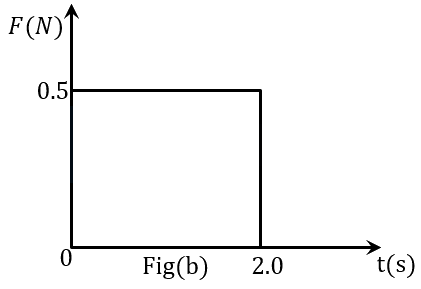
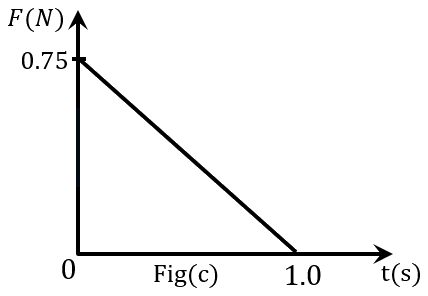
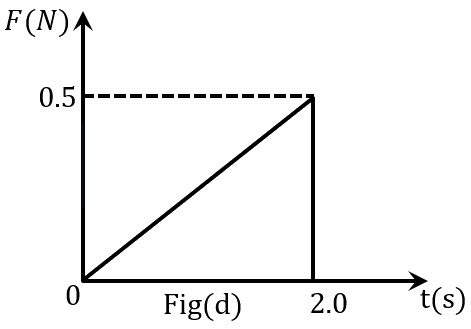
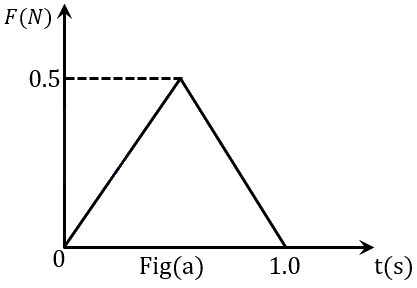
Figures (a), (b), (c) and (d) show variation of force with time.
The impulse is highest in figure.

Show answer and solution

Answer: (B) Fig (b)

As we know, impulse is the area under the curve of the force vs. time graph. So, analysing each figure area under curve.
(a)A1=12×1.0×0.5=14N‐s\left(a\right){A}_{1}=\dfrac{1}{2}\times 1.0\times 0.5=\dfrac{1}{4}N‐s
(b)A2=0.5×2=1N‐s\left(b\right){A}_{2}=0.5\times 2=1N‐s
(c)A3=12×1×0.75=38N‐s\left(c\right){A}_{3}=\dfrac{1}{2}\times 1\times 0.75=\dfrac{3}{8}N‐s
(d)A4=12×2×0.5=12N‐s\left(d\right){A}_{4}=\dfrac{1}{2}\times 2\times 0.5=\dfrac{1}{2}N‐s
From above calculations, area under curve in figure (b) is maximum. Thus, fig (b) impulse is highest.
JEE Main question paper PDF

Open a shift to read the full paper on this page, or download it.

JEE Main 2025 Apr 2 Shift 1 question paper

Open Download PDF

Opening paper…

Explain it as a whiteboard videoStep-by-step, in Hinglish or English. Your first video needs no login.Solved it on paper but got it wrong?Upload a photo of your working. Mistake Doctor marks the exact line that broke.
Revise Rotational Motion firstFormula sheet, solved examples and the traps students fall into.

More Physics practice

JEE Main Physics practice question on Center of Mass, Momentum & Collision (Impulse), with the answer and a step-by-step solution. Scan a question from your own book or paper to get a whiteboard video.