Question 67 of 380
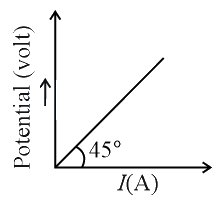
The variation of applied potential and current flowing through a given wire is shown in figure. The length of wire is . The diameter of wire is measured as . The resistivity of the given wire is measured as . The value of is _____ .
[Take ]
Show answer and solution
Answer: 144
Since, slope of V−I graph represents the resistance, so
Now, resistance of wire is given by
So, resistivity of the wire is
Now, resistance of wire is given by
So, resistivity of the wire is
